The Fieldmouse Platform is a web-based IoT management system — accessible from any smart device with a browser. Real-time dashboards, live control of outputs, historical data graphing, and role-based access give your team complete visibility and control across every connected site.
Main Dashboard
The Fieldmouse main dashboard presents every application and system in your deployment as a single, unified view. Each icon represents a system or application — pump stations, irrigation zones, lighting circuits, security cameras, utility meters — all visible at a glance from any smart device with a web browser.
Each system may have multiple field devices associated with it. Locations are GPS and time-zone referenced, so assets are always positioned correctly regardless of which state or territory they operate in.
The interface is fully HTML5 compatible and automatically rescales to suit any screen size — desktop, tablet, or mobile — with no app installation required. Running your cursor over an icon (or tapping it on touch devices) opens a pop-up showing the system name. Tapping or clicking again navigates directly to that system's own dashboard.
Platform Capabilities
Each system dashboard gives operators a complete operational picture — live status, manual override, scheduling, and data graphing all in one place.
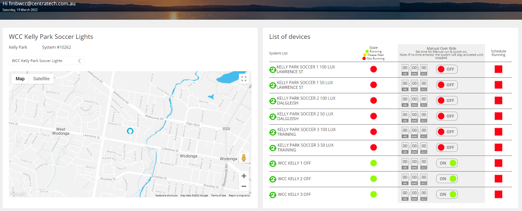
Each system has its own dedicated dashboard — showing a mapped view of the area with device positions, current status, and live data overlaid directly on the layout.
A complete time-stamped history of every relay activation and deactivation is stored and accessible from the platform — providing a full audit trail of all output events for reporting and fault-finding.
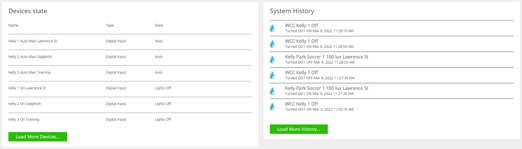
See at a glance which field devices are online and communicating. Command status is shown in real time — whether a command is pending, being sent, received, or has been actioned by the device.
Live status of every digital input, digital output, and relay is visible on the dashboard. Analogue inputs display their real-time engineering value — flow rate, pressure, level, temperature, and more.
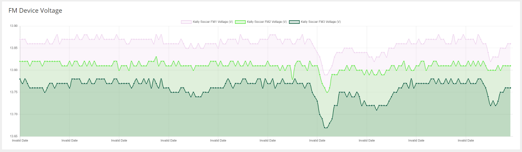
Configured graphs can be attached directly to any system dashboard. Visualise trends in sensor readings, consumption data, or any analogue input over time — without leaving the dashboard view.
Active schedules are visible directly on the dashboard — showing what is running, when it was triggered, and when it will next operate. No need to navigate to a separate scheduling screen to check current state.
Interactive Control
Operators can interact with any connected output directly from the platform, without waiting for a scheduled event or travelling to site.
| Capability | View | Control | History |
|---|---|---|---|
| Live Status | |||
| Digital Input Status | |||
| Analogue Input Value (Real-Time) | |||
| Device Online / Offline | |||
| Output Control | |||
| Manual Relay / Output Operation | |||
| Scheduled Operation Status | |||
| Command Sent / Received / Actioned | |||
| Analytics | |||
| Relay Activation & Deactivation Log | |||
| Configured Data Graphing | |||
Access & Security
The Fieldmouse Platform uses authority-based access control — each user sees and can operate only what their role permits.
Full system access — configure devices, manage users, define schedules, set alerts, and access all historical data across every site in the deployment.
Monitor and control assigned systems — manually operate outputs, view live data, acknowledge alerts, and manage day-to-day operations without access to system configuration.
Scoped access for specific actions — for example, a sports club member who can turn field lighting on and off for a booked session, without visibility of any other system or site.
Request a live demonstration to see real-time dashboards, control, and data graphing across a connected deployment.
Get in Touch